A brief introduction to Big Data
We all use electronic devices, computers, phones etc. But have we ever wonder how much data all these devices are generating, in the form of text, phone calls, emails, photos and videos, web searches and music? Approximately, 40 exabytes of data generated every month by a single smartphone user. And if we multiply that number by 5 billion smartphone users. Such quantity of data is a lot for a single mind to process and understand, and we haven't even taken into account the data generated by other devices. This amount of data is even a lot for traditional computing systems to handle. This massive amount of data is what we call Big Data.
Let's have a look at the data generated per minute on the internet:
- 3.5 million google search queries
- 1 million logins on the facebook
- 4.5 million videos are watched on youtube
- 188 million emails are sent
This data is just a representation of the data are actually out in the world. So, how do we classify any data as Big Data? To classify any kind of data need to use the concept of 5 V's of Big Data
- Volume Big data refers to huge amounts of data. For large data set points, this volume is regarded as the initial dimension. However, depending on the industry and the organisation, the first V is the least operational and most adaptable. Today, we speak about storing and processing exabytes (1018) or even zettabytes (102) of data, yet only ten years ago, we were talking about megabytes (10°) on floppy discs.
- Velocity The pace at which data is created, processed, and stored is referred as the velocity. It implies that the immediacy and instantaneity with which we receive or transfer data is crucial for everyone of us and for a range of activities, driving organisations to improve their reaction and anticipation velocity. A big technological obstacle is the multiplicity of data sources and formats.
- Variety It denotes the type of data, which might be organised, semi-structured, or unstructured. It also refers to a number of other sources. Variety refers to the appearance of data from new sources, both inside and outside of an organisation. It is classified into three types: organised, semi-structured, and unstructured.
- Veracity It has to do with the data's messiness or dependability. Many forms of big data have less control over quality and accuracy (think Twitter tweets with hash tags, abbreviations, typos, and colloquial speech, as well as the reliability and correctness of material), however big data and analytics technology today allows us to cope with a variety of data. The volume frequently compensates for a lack of quality or precision.
- Value Last but not least, big data must be useful. That is, if you are going to invest in the infrastructure required to collect and comprehend data on a system-wide scale, you must ensure that the insights delivered are based on accurate data and result in verifiable improvements.
We have seen how to classify the data as Big Data, but how do we store and process such massive amounts of data? We can store, process and analyze Big Data with the help of different frameworks such as Hadoop, Spark etc. Let's take for example the Hadoop framework and see how it works.
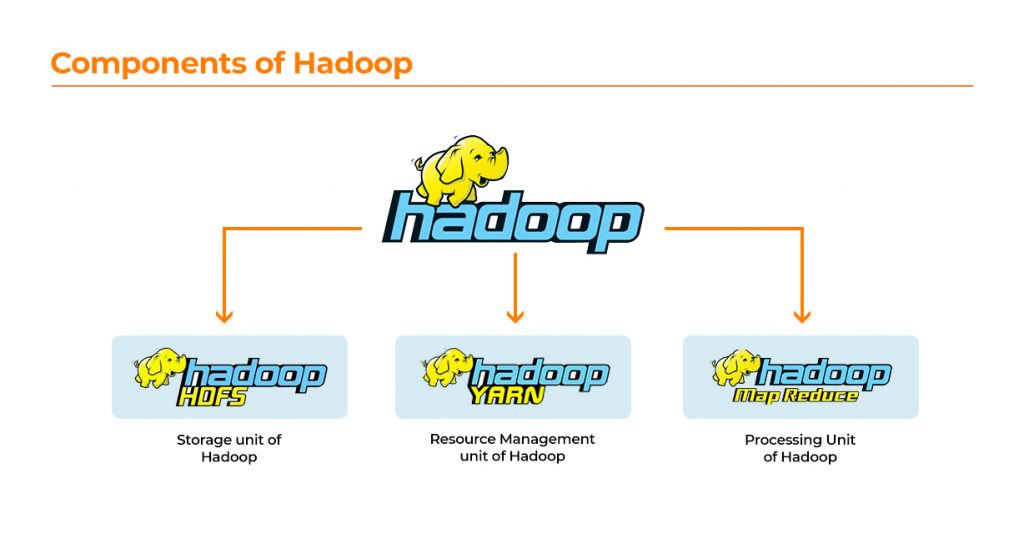
The basic Hadoop framework is made up of four components that work together to produce the Hadoop ecosystem:
- Hadoop Distributed File System (HDFS): The Hadoop Distributed File System (HDFS) is a distributed file system that allows high-throughput access to application data without the requirement for schemas to be set ahead of time.
- Yet Another Resource Negotiator (YARN): YARN is a resource-management platform that manages compute resources in clusters and uses them to schedule applications for users. It manages the scheduling and resource allocation of the Hadoop system.
- Hadoop MapReduce is a tool designed to handle data in a Hadoop cluster in a distributed, massively parallel manner. Hadoop MapReduce's design consists of a computer that serves as a JobTracker. JobTracker and TaskTracker have a working relationship that is similar to that of a master and slave. As a master, JobTracker keeps data on the parallel processing of data blocks on HDFS. JobTracker understands which machine is in charge of processing each of these data blocks. JobTracker watches and manages computers that are simultaneously processing data blocks. TaskTracker, on the other hand, is a set of computer employees who process data blocks as part of a function. In this context, a Task is a procedure that runs on each computer in order to process each data block. TaskTraker will handle and oversee a number of Tasks throughout time and will deliver frequent reports to JobTracker. Heartbeat refers to TaskTracker's periodic reports to JobTracker. JobTracker can assess and regulate TaskTracker's state based on its pulse.
- Hadoop common, also known as Common utilities, is nothing more than a java library and java files, or the java scripts required by all of the other components present in a Hadoop cluster. HDFS, YARN, and MapReduce need these tools to run the cluster. Hadoop Common confirms that hardware failure in a Hadoop cluster is common and that the Hadoop Framework must manage it automatically in software. Since the data have properly been stored and processed, they can be analysed for all kind of applications
The emergence of big data indicates an increasing awareness of the "power" of data and the need to improve data collection, exploitation, sharing, and analysis. Analytics solutions will ensure the right use of ever-increasing volumes of data for a wide range of business objectives, including not only the generation of fundamental data-driven insights into operations, but also the prediction of future trends and occurrences. There are many types of analytics and need to have a basic idea how they organised and used. Let's see the diagram below.
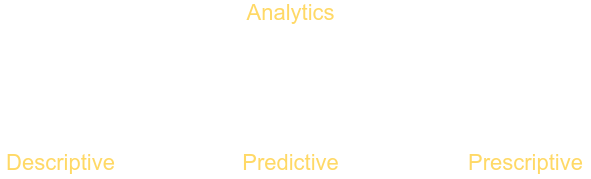
Descriptive analytics is one of the most common forms of analytics that firms employ to stay current on trends and operational performance. It is one of the first steps in analysing raw data, and it includes basic mathematical operations as well as the formulation of statements regarding samples and measurements. After you've discovered patterns and insights using descriptive analytics, you can utilise other types of analytics to learn more about what's driving those trends.
Predictive analytics, as the name suggests, is concerned with foreseeing future events. Market trends, consumer trends, and a number of other market-related events might be included in these future episodes.This type of analytics forecasts future events using historical and present data. This is the most prevalent type of analytics utilised in enterprises.Customers gain from predictive analytics as well as service providers. It maintains track of our previous actions and anticipates what we will do next depending on them.
Prescriptive analytics, the most significant and underutilised big data analytics method, gives you a laser-like focus on answering a single query. Given the current circumstances, it aids in choosing the best solution from a plethora of options and suggests suggestions for capitalising on a future opportunity or avoiding a future hazard. It may also be used to show the implications of each action to improve decision-making.
References
- What is Apache Hadoop?
- The 5 V’s of big data
- Apache Hadoop
- Sedkaoui, Soraya. Data Analytics and Big Data. 2018. Web.